A before-and-after regression report that explains overlap, own time and failed-token spending.
Node 22.18+ and Python 3 for the grader; TypeScript objects, arrays, Map, sorting and interval arithmetic. The core uses standard libraries. The grader checks your selected workspace; it never fills in missing behavior from the reference.
Build and run your version
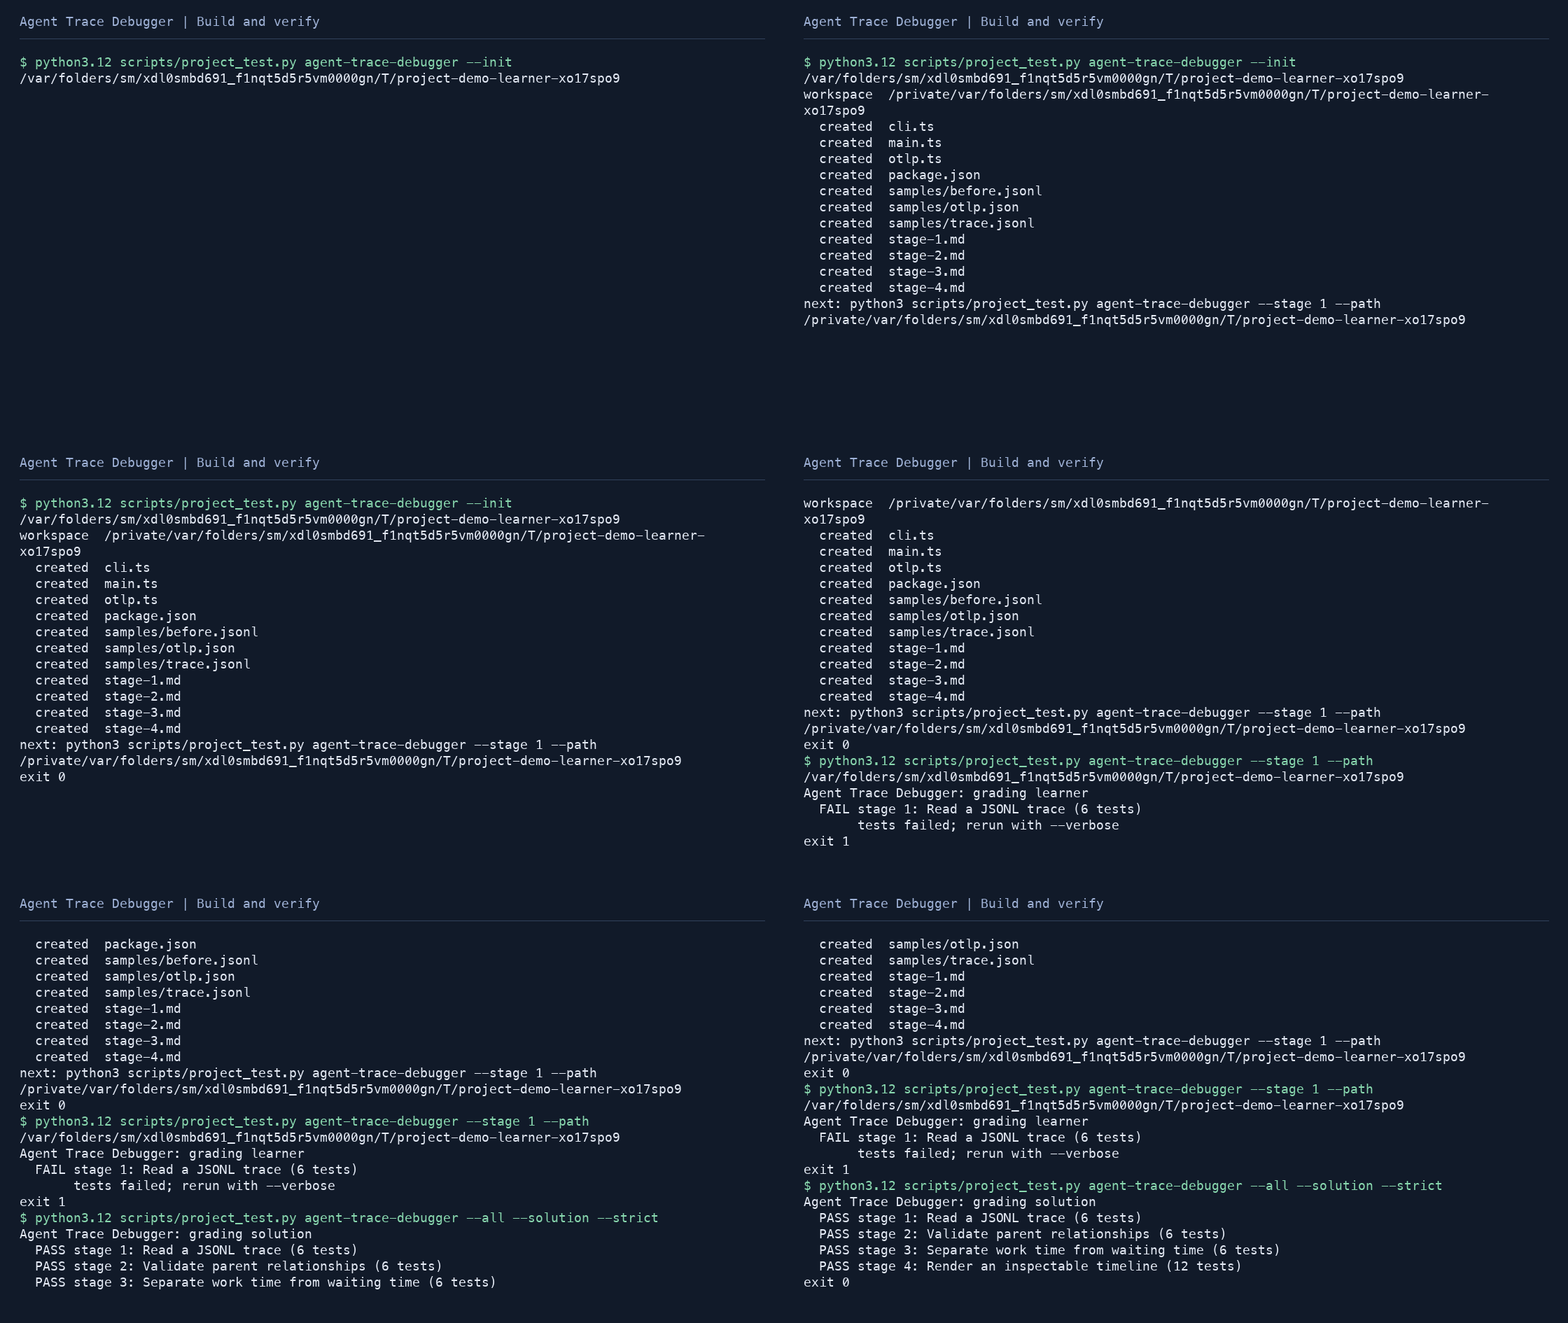
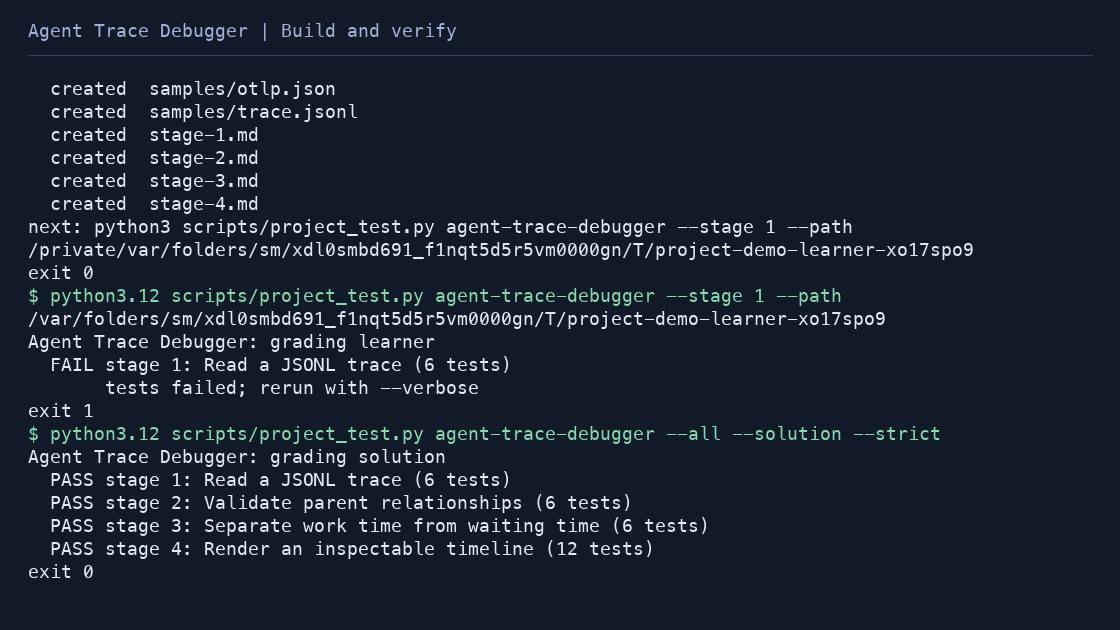
From the repository root, initialize once. A fresh starter fails intentionally.
python3 scripts/project_test.py agent-trace-debugger --init learning-artifacts/agent-trace-debugger
python3 scripts/project_test.py agent-trace-debugger --stage 1 --path learning-artifacts/agent-trace-debugger --strict
Implement each stage, then run the cumulative grader and the supplied input driver:
python3 scripts/project_test.py agent-trace-debugger --all --path learning-artifacts/agent-trace-debugger --strict
cd learning-artifacts/agent-trace-debugger
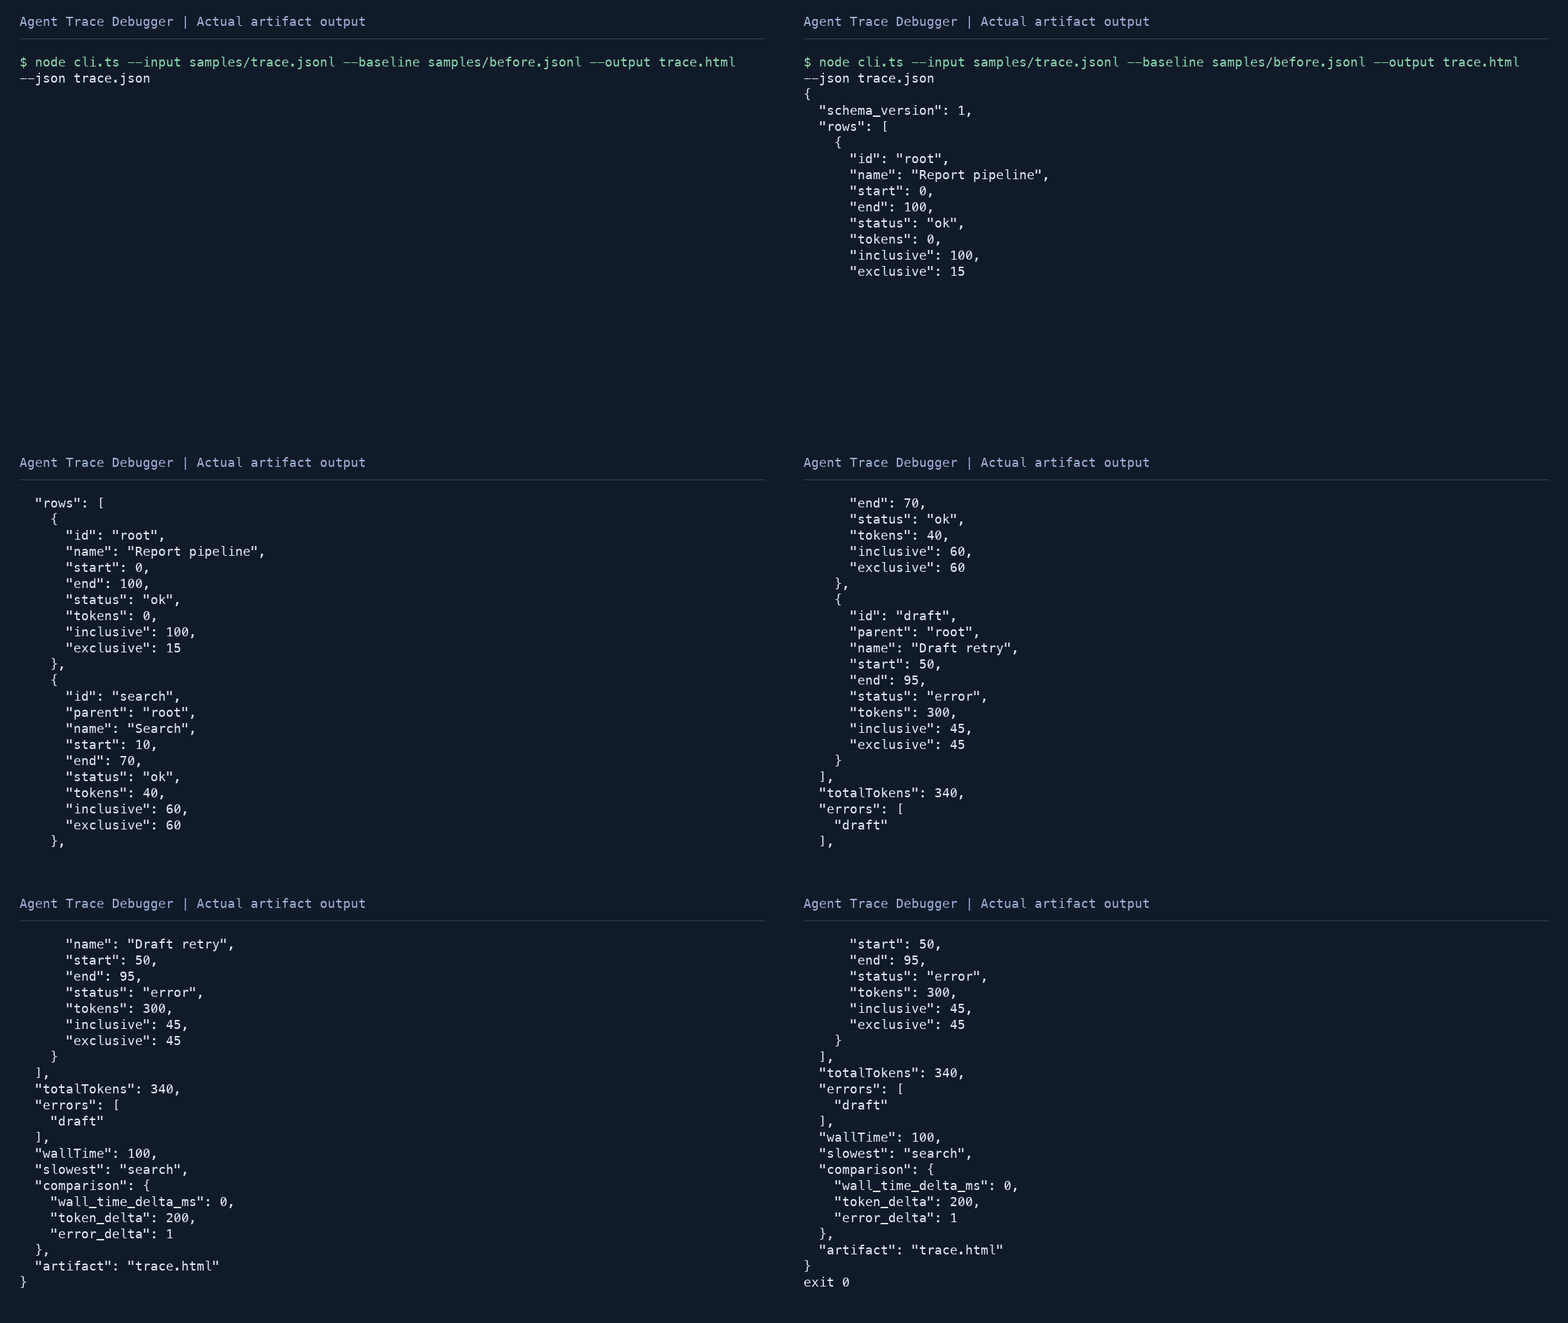
node cli.ts --input samples/trace.jsonl --baseline samples/before.jsonl --output trace.html --json trace.json
The driver and offline samples are provided scaffolding. Its imports resolve to your implementation. Public input types and function signatures live in the starter and API contract.
Inspect the reference separately
From the repository root:
python3 scripts/project_test.py agent-trace-debugger --all --solution --strict
cd projects/agent-trace-debugger/solution
node cli.ts --input samples/trace.jsonl --baseline samples/before.jsonl --output trace.html --json trace.json
Observe the change
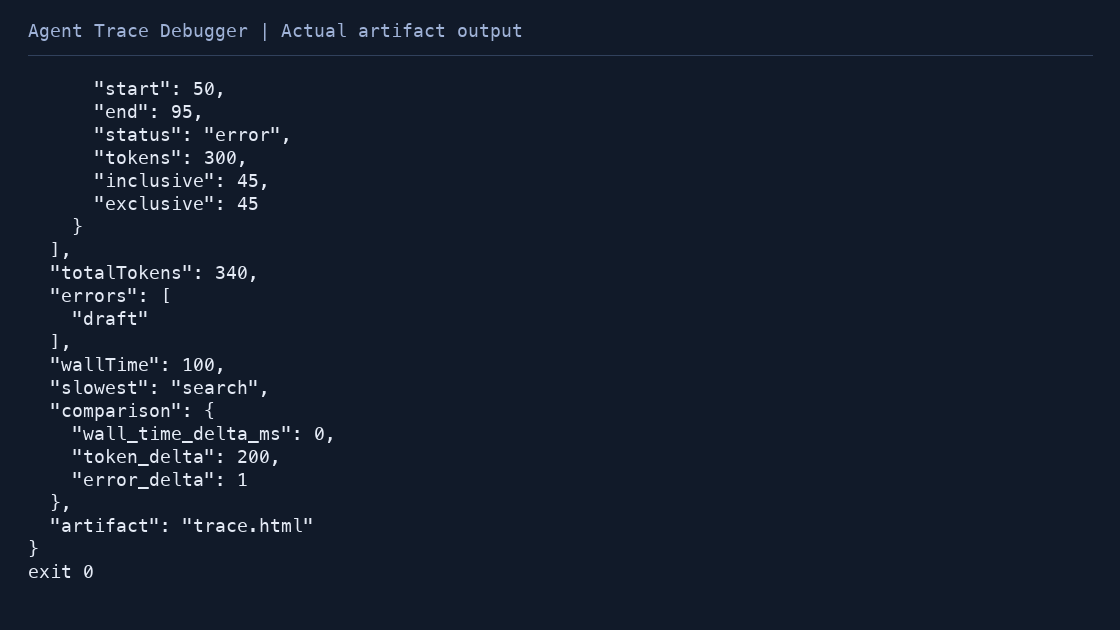
The supplied run keeps 100 ms wall time while failed-span tokens rise by 200 and the error count rises by one. The timeline exposes the changed span instead of treating unchanged wall time as unchanged behavior.
Edit a copy of the sample and rerun the command. Keep the input beside the output so someone else can reproduce the result; the supplied samples are authored teaching data.
Integration and limits
Export one Span JSON object per line from your instrumentation and retain trace.json beside trace.html in CI.
Input is the documented JSONL Span contract or the bounded OTLP JSON adapter described below. Tokens must be exclusive per-span usage. Cross-machine clocks must be normalized before import.
Stages
- Read a JSONL trace
- Validate parent relationships
- Separate work time from waiting time
- Render an inspectable timeline
Primary references
OpenTelemetry traces concepts Node test runner
Import OTLP JSON
otlp.ts accepts the resourceSpans/scopeSpans/spans JSON shape. It normalizes nanosecond timestamps with BigInt before converting differences to milliseconds, prefixes span ids with trace ids and reads gen_ai.usage.input_tokens/output_tokens attributes. Missing parents still fail the tree validator; this is a JSON adapter, not a collector or protobuf decoder.
node cli.ts --format otlp --input samples/otlp.json --output otlp-trace.html --json otlp-trace.jsonThe authored export has one 15 ms error span and 60 tokens. Keep token attributes local to each span to avoid double counting.