Help a community organizer explain a small dataset by selecting explicit aggregations and chart forms from column roles. Tie each annotation to the plotted values, expose missing data and axis choices, and export an SVG chart sequence with HTML and machine-readable chart specifications.
The implementation uses Python 3.10+ and standard libraries. Samples are original teaching data. Read API.md for exact input, output and error contracts.
Build your version
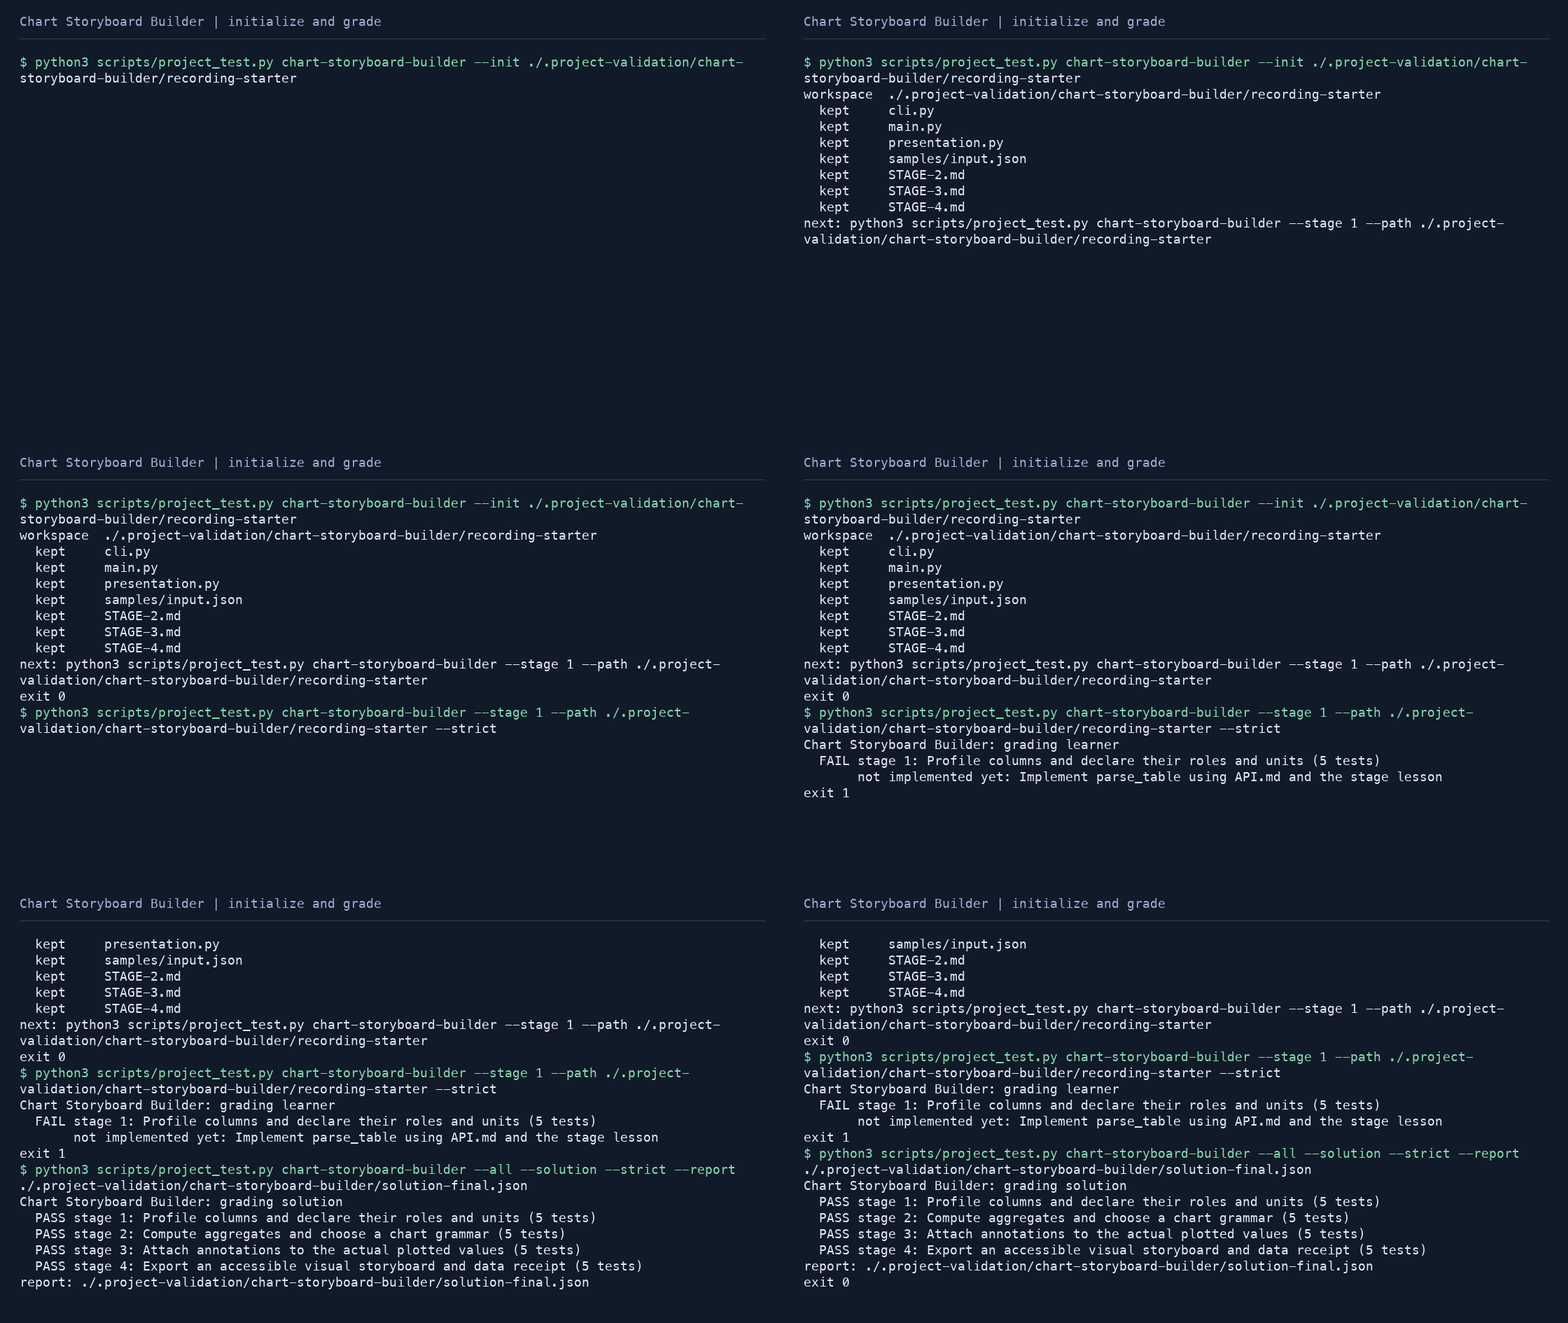
python3 scripts/project_test.py chart-storyboard-builder --init learning-artifacts/chart-storyboard-builder
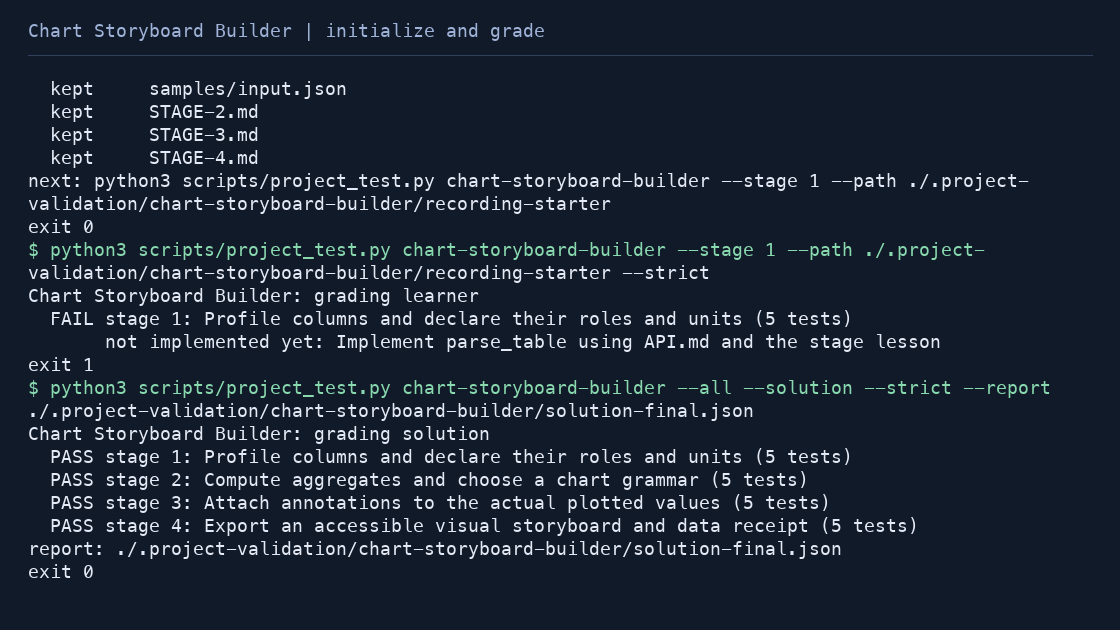
python3 scripts/project_test.py chart-storyboard-builder --stage 1 --path learning-artifacts/chart-storyboard-builder --strict
A fresh starter fails clearly until you implement the first contract. Later stages retain your source file. The supplied CLI and presentation helpers are scaffolding; all domain decisions call your implementation.
python3 scripts/project_test.py chart-storyboard-builder --all --path learning-artifacts/chart-storyboard-builder --strict
cd learning-artifacts/chart-storyboard-builder
python3 cli.py samples/input.json --output my-output
Run the reference and your own input
python3 scripts/project_test.py chart-storyboard-builder --all --solution --strict
cd projects/chart-storyboard-builder/solution
python3 cli.py samples/input.json --output demo-output
python3 cli.py /absolute/path/to/your-input.json --output your-output
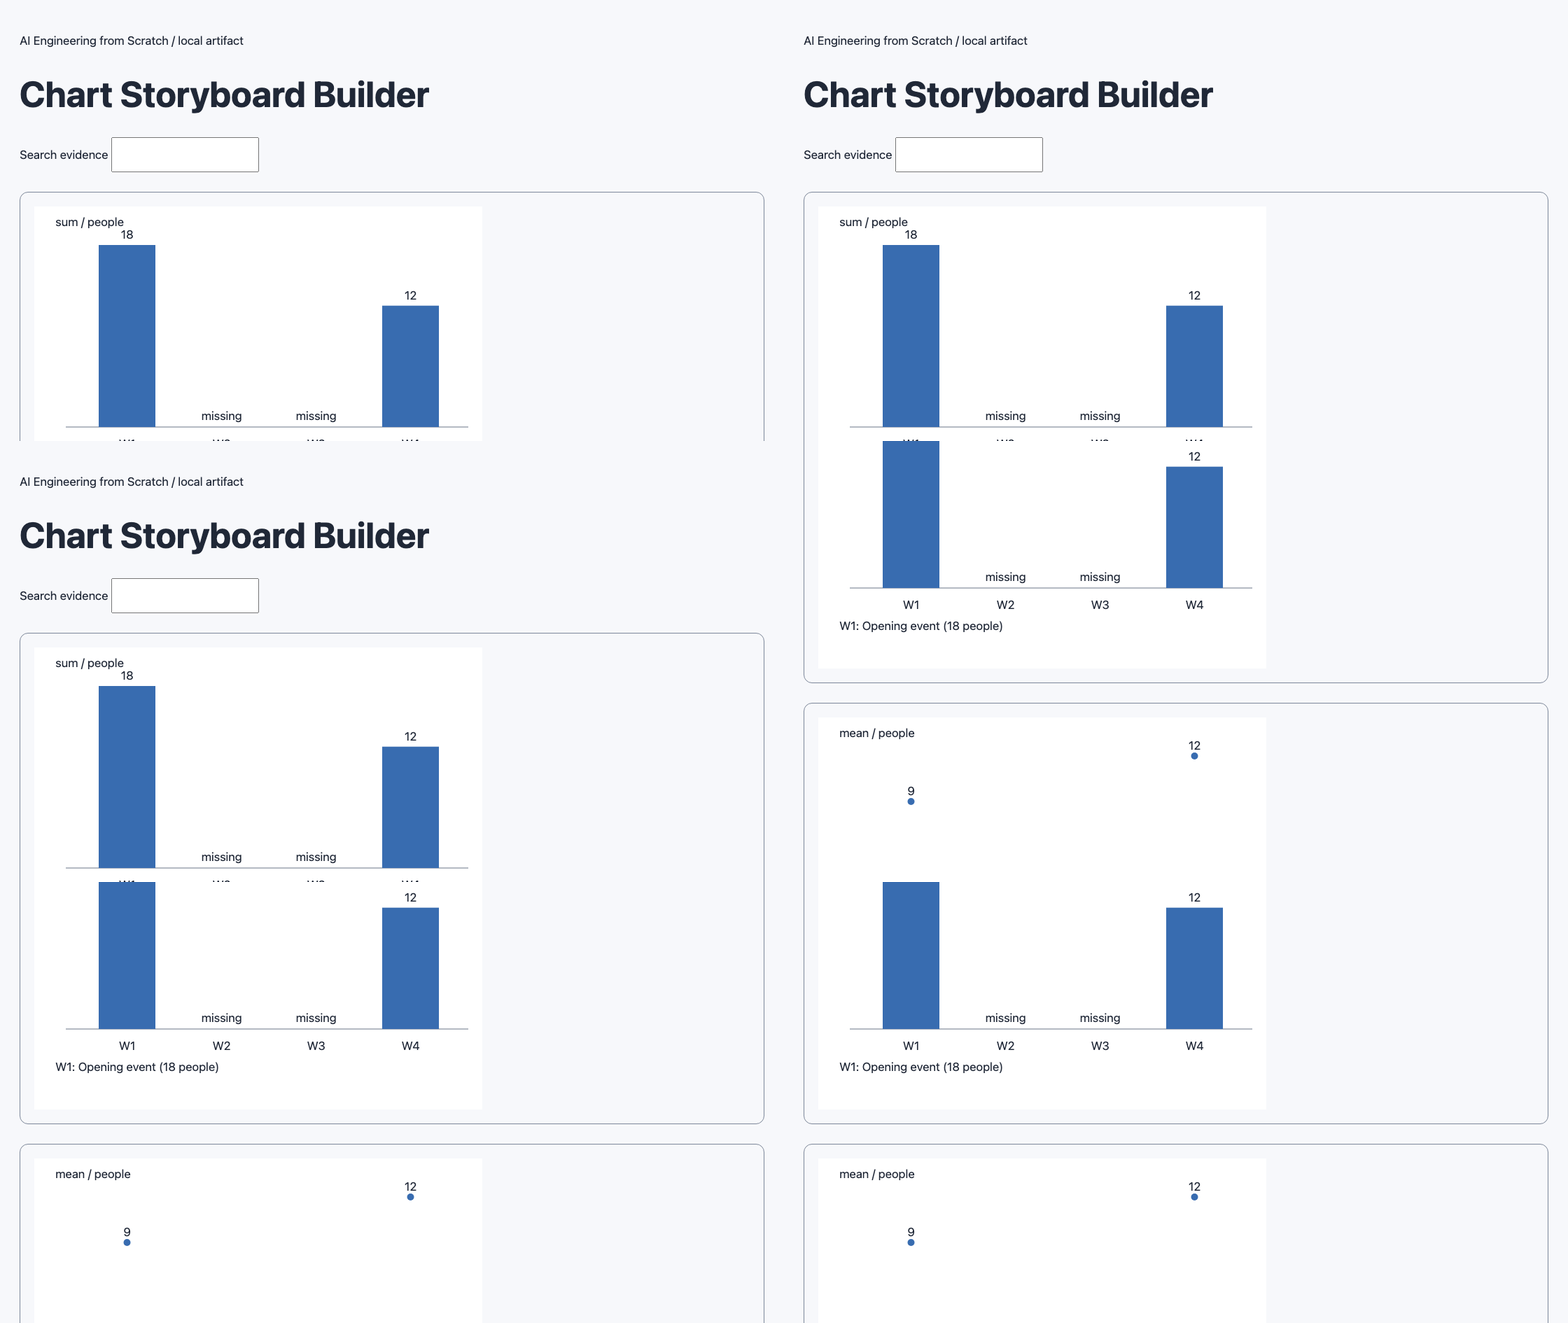
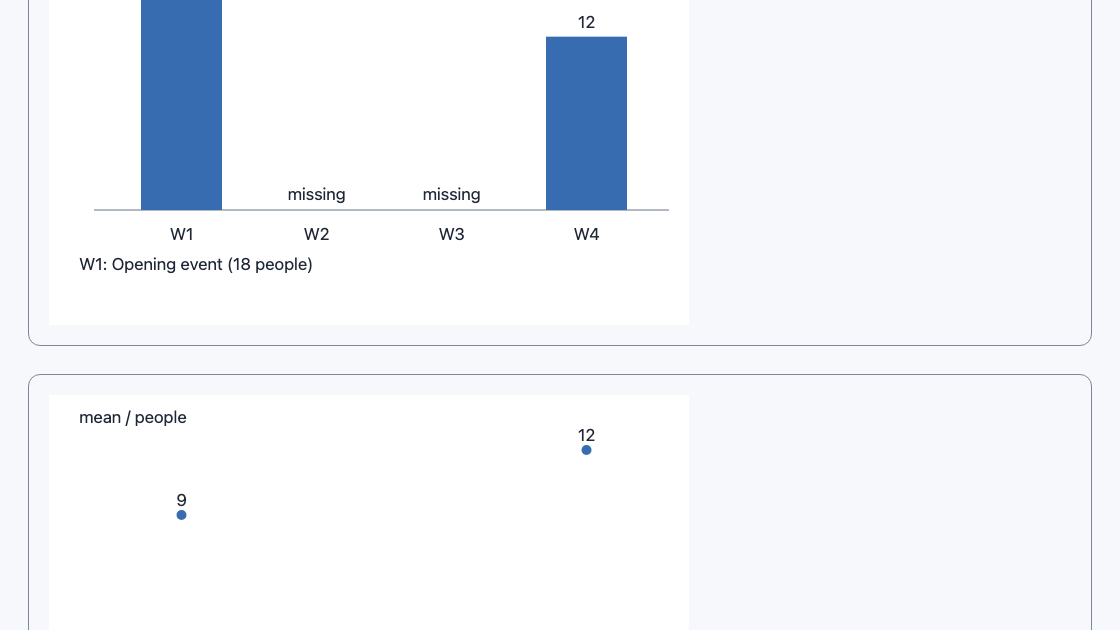
Input JSON contains csv, roles, optional periods, and charts [{grammar,reducer,annotations}]. Outputs chart-N.svg, chart-specs.json, storyboard.html. The consumer loads chart-specs.json, selects each charts entry and calls render_svg(spec); this reproduces the portable visual without the input CSV.
Worked example and limits
The authored attendance table has week 1 values 8 and 10, week 2 blank, and week 4 value 12. A blank has no numeric value.
This tool supports categorical bars and ordered lines with explicit period order. It does not infer dates, causation or confidence intervals; use a separate statistical analysis for those.
Stages
- Profile columns and declare their roles and units
- Compute aggregates and choose a chart grammar
- Attach annotations to the actual plotted values
- Export an accessible visual storyboard and data receipt